Opportunity Identified

for the curious investor

  • Home
  • About
    • Founder’s Story
    • This Blog
    • 360 Investment Research
    • The 360 Process
    • Client First Tax and Wealth Advisors
  • Insiders Only
  • Contact Us

August 21, 2017 | Posted by David Zarling, Head of Investment Research

Forget Bitcoin. This Major Asset Is About To Impact Your Portfolio.

0
0
0
0
0
0
0
0
0
0
0
0
0
0
0
0
0
0
0
0
0
0
0
0

Back in February, we highlighted some important developments which could impact the months ahead. One of those developments was the consolidation of the U.S. Dollar.  Back then, we wrote:

Another important development is the consolidation of the U.S. Dollar… the US Dollar broke out above previous resistance in the 4th quarter of 2016. On the daily chart of the U.S. Dollar, we’re compressing between $99 and $101. A break above the upper green trendline would signify a resumption of the uptrend started in 2014. And if price moves below $100, there is no reason to own the greenback. If the Dollar moves down through this important level, we could have a false move on our hands…

Here’s the U.S. Dollar back on February 27th:

US Dollar Daily Chart

The power of using price charts is we can identify where demand and supply dynamics change and use these levels to manage risk, the most important part of being a market participant. We identified the $99-100 level as important support. Here’s the updated chart:

US Dollar Updated

We can quickly see the Mighty Dollar broke down below the important $99-100 level, creating a false move. From false moves come fast moves in the opposite direction. As market participants, we didn’t need to predict the Dollar’s next move. We just need to have a game plan if buyers didn’t show up where they should have. They didn’t show up, opening up the window to the next possible level of logical demand from buyers. In our follow-up post from May, we wrote:

If the selling continues, we’d expect buyers to show up near the $92-93 handle

Six months after recognizing the potential for a false move, we’re at the $92-93 level in the U.S. Dollar. In fact, the U.S. Dollar has fallen over 10% since we identified potential selling pressure on the world’s reserve currency of choice. While the visual math of supply and demand for the Greenback pointed to potential demand issues, The Economist was busy regurgitating the popular narrative at the time:

Economist Cover - US Dollar

We can’t make investment decisions based on magazine covers. That would be as silly as trying to predict where the market will be by the end of the year. We’ll leave that for sell-side jockeys and magazine publishers. But we can use visual math (aka charts) to identify important support and demand levels for any liquid asset. Today, we’re in the $92-93 window identified back in May. Buyers have shown up to at this level many times over the past three years. Will they do so again? We have no idea. No one does (except maybe The Economist – sorry, couldn’t resist another jab). Our job as market participants is not to predict. Our job is to manage risk by identifying if/then scenarios to operate from. Here’s the visual:

US Dollar Bigger Picture

From this level, market participants have options. If you want to be long the US Dollar and think it can go higher from here, you could use $92 as your stop. Keep it simple. Above $92, own Dollars. Below $92, let someone else own Dollars. On the opposite side, if you want to be short Dollars, you can use $94 as your line in the sand. Above $94, you don’t want to be short the Mighty Dollar.

In conclusion, the $92-93 level for the U.S. Dollar is a pivotal one. Demand should show up here. If it doesn’t, we have our clue. Below $92, and selling pressure could take it down to the $86 level. Since many market pieces are priced in Dollars, this next directional move could have an impact across a variety of assets, including commodities and foreign equity markets. Trade accordingly.

As always, you can get real-time updates and commentary about this development and many more opportunities here: @360Research

AND, you’ve got FREE access to an investing tool we’ve created, The Ultimate ETF Cheat Sheet. Click this link to get your FREE easy-to-use resource guide for all your ETF needs.


Disclaimer: Nothing in this article should be construed as investment advice or a solicitation to buy or sell a security. You invest based on your own decisions. Everything in this post is meant for educational and entertainment purposes only. I or my affiliates may hold positions in securities mentioned in this blog. Please see our Disclosure page for full disclaimer.

Filed Under: Breakdown, Currency, False Move, Supply and Demand, U.S. Dollar Tagged With: $DXY, $USD, $USDJPY, $UUP, Greenback, US Dollar

May 22, 2017 | Posted by David Zarling, Head of Investment Research

This Important Piece Of The Market Puzzle Will Impact Your Portfolio

0
0
0
0
0
0
0
0
0
0
0
0
0
0
0
0
0
0
0
0
0
0
0
0

Back in February, we highlighted some important developments which could impact the months ahead. One of those developments was the consolidation of the U.S. Dollar.  Back then, we wrote:

Another important development is the consolidation of the U.S. Dollar… the US Dollar broke out above previous resistance in the 4th quarter of 2016. On the daily chart of the U.S. Dollar, we’re compressing between $99 and $101. A break above the upper green trendline would signify a resumption of the uptrend started in 2014. And if price moves below $100, there is no reason to own the greenback. If the Dollar moves down through this important level, we could have a false move on our hands…

Here’s the U.S. Dollar back on February 27th:

US Dollar Daily Chart

The power of using price charts is we can identify where demand and supply dynamics change and use these levels to manage risk, the most important part of being a market participant. We identified the $99-100 level as important support. Here’s the updated chart:

US Dollar Daily Chart Updated

While recording new highs in early January, the U.S. Dollar Index was also logging lower highs in 14-Period RSI (our favorite momentum indicator). New highs and lagging momentum can sometimes signal limited upside continuation. In this case, the divergence in momentum was an important tell for the demand of U.S. Dollars. This was confirmed when buyers could not keep the Greenback from breaking $99, a significant level over the past 2.5 years. You can see this important level better when we step back to a bigger picture timeframe. It’s always important to look at the bigger picture. Here’s the weekly chart of the U.S. Dollar Index dating back to 2010:

U.S. Dollar Weekly Chart

The importance of the $99-100 level can be clearly seen. Sellers showed up twice at that level in 2015 making the breakout at the end of 2016 notable. However, since the highs in January, selling pressure has returned. The increase in supply has created a false move. From false moves come fast moves in the opposite direction. The fast move in the opposite direction is taking place right now. We don’t need to predict. Price shows us there’s no need to be a buyer of U.S. Dollars right now.

In conclusion, the Almighty Dollar, an important piece of the market puzzle, needs to prove itself before we’d consider a long position. If the selling continues, we’d expect buyers to show up near the $92-93 handle, an area where they showed up in the past (see green annotated arrows in the chart above). Since many market pieces are priced in Dollars, this current move could have an impact across a variety of assets, including commodities and foreign equity markets.

As always, you can get real-time updates and commentary about this development and many more opportunities here: @360Research

AND, you’ve got FREE access to an investing tool we’ve created, The Ultimate ETF Cheat Sheet. Click this link to get your FREE easy-to-use resource guide for all your ETF needs.


Disclaimer: Nothing in this article should be construed as investment advice or a solicitation to buy or sell a security. You invest based on your own decisions. Everything in this post is meant for educational and entertainment purposes only. I or my affiliates may hold positions in securities mentioned in this blog. Please see our Disclosure page for full disclaimer.

Filed Under: Currency, False Move, Market Environment & Structure, Market Outlook, Risk Management, Supply and Demand, U.S. Dollar Tagged With: $USDEUR, $USDJPY, $USDMXN, $USDX, $UUP, US Dollar

January 24, 2017 | Posted by David Zarling, Head of Investment Research

This Is What Drives The Next Big Move In Oil

0
0
0
0
0
0
0
0
0
0
0
0
0
0
0
0
0
0
0
0
0
0
0
0


One of the more interesting developments over the past nine months is the rising price of Oil within a rising U.S. Dollar environment. Since early May 2016, we’ve seen both Oil and the Dollar increase in value. While not impossible, it’s a relationship dynamic worth paying attention to. More often than not, a falling Dollar is a tailwind for commodity prices. Conversely, a rising Dollar is a headwind for commodities, like Oil. For example, from July 2014 through March 2015, the U.S. Dollar appreciated almost 26% against other major currencies (using the U.S. Dollar Index as our gauge). During the same timeframe, West Texas Crude (continuous contract) dropped almost 58%. So when we see black gold and the mighty greenback rising together, we sit up and take notice. Oil is showing some strength in the face of a mighty headwind.

Check out the charts below. First, we see the normally negative correlation between the U.S. Dollar and Oil in full effect. The chart is a bit color-crazy at first. Take time to digest it. The upper pane is the U.S. Dollar. The lower pane is Oil. The majority of the time, when the Dollar falls, Oil rises and vice versa. However, sometimes they move together, or one is moving a direction while the other is flat. This latter characteristic can be a precursor of major price moves to come. Look at the period in late-2010 through mid-2011. The Dollar is rising and Oil is flat. What happens when the Dollar finally falls in value? Oil jumps 68%. Similarly, as foreshadowed in the opening of this article, the period of mid-2013 through mid-2014 had the Dollar down, yet Oil could not budge upward. As soon as the Dollar took off in mid-2014, Oil’s 2013 weakness during a falling Dollar period was a precursor to a nasty 58% drop in value.

Chart of Longterm Oil v Dollar

Further examination of the chart above shows we’re currently in a period where the Dollar and Oil are rising together. This synchronized move has been in place since early 2016. This is a warning. Eventually, one or the other will give and the subsequent price moves will be fast and furious. If the Dollar keeps rallying, expect this recent Oil breakout to fail. On the other hand, if the Dollar drops here, we could see an impressive upward move in Oil which targets $75 (+41% from current levels).

Digging deeper into our analysis, we find seasonality can be an important part of our process. Seasonality, in relation to markets, is simply the recurrence of similar price movements during certain periods of the year. It’s the tendency for commodities (or stocks, bonds, currencies) to perform better during some time periods and worse during others. Seasonality is not as important as price itself, but it’s still a powerful piece of evidence. What does seasonality look like for the Dollar and Oil? I thought you’d never ask.

Below is the seasonality of Oil for the past 10 years. This shows the percentage of months in which Oil closed higher than it opened. The bar height shows the percentage time that a month is positive. The number at the bottom of each bar is the average return for that month during the past 10 years. Accordingly, January’s bar represents the past 10 Januarys. We can easily see Oil has been up in January only twice (20%) in the past 10 years with an average return of -3.5%. When we look at this year, however, it sticks out like a sore thumb. As of Friday’s close, Oil is up about 1.7%. This could obviously change between now and January 31st. But the strength out of Oil during a seasonally weak month for this energy commodity is worth noting. In addition, February is almost a week away. During the past 10 years, February has been the best performing month for Oil by a wide margin. Up 90% of the time with an average return of +5.1% is significant. Combined with the correlation (or lack thereof) highlighted at the beginning of this article and the breakout levels identified below, there is a powerful case to be made that Oil is on the verge of a large move upward move.

Oil Seasonality for Past 10 years

Not to be ignored, here’s the seasonality chart for the Dollar. It uses the same parameters as the seasonal chart for Oil. Right off the bat, we notice January is an okay month for the Dollar; up 55% of the time with an average return of 0.8%. For the current month, however, the Dollar is down almost 2.5%. And next month’s seasonality for the Dollar is quite different. The Dollar is only up 40% of the time with an average return of -0.1%.

Dollar Seasonality 10 years

So we are heading into February, which is one of the weakest months for the Dollar and the strongest month for Oil during the past 10 years. We think things are about to get very interesting for one of the most important commodities on the planet.

Let’s dig into some charts of Oil and the Dollar. We know that each asset must stand on its own merit from a price perspective. And we care about important levels of supply and demand as they mark levels of risk when we consider entering a trade. In addition, if we’re going to enter a trade, we better have an exit plan. Identifying areas of supply and demand can help us do just that. Scrutinizing both charts brings further clarity about important risk management levels. After all, if we’re trying to make money in the markets, we’re in the risk management business. We care about being on the right side of the trade. And if we’re on the wrong side, it would make sense to know WHEN we’re on the wrong side.

Here’s the weekly chart of Oil.

Weekly Chart of Oil

The weekly divergence between price and 14-period RSI was a clue that Oil would eventually rebound. Since early 2016, we’ve seen Oil rally (don’t worry, it started before Trump was President so we can’t call this a “Trump Rally”). This past December, Oil broke through and held the $50 level. Previously an area where sellers showed up to drive price back down, a move above this level was significant. And the longer it holds above this level, the more significant that breakout is.

Here is the daily chart of Oil.

Daily Chart of Oil

It’s easy to see Oil price consolidating and compressing above the very important $50 level. A break upward out of this consolidation would start the race to $75. On the other hand, we want nothing to do with this underneath $50. The line in the price is clear. Above $50, it makes sense to own it. Below that, it can be someone else’s problem.

Likely to be in conjunction with Oil’s next leg, is a move in the US Dollar. Nothing is guaranteed. Oil and the Dollar can keep moving in similar directions. But, the evidence suggests that when the current positive correlation is broken, both will experience significant moves.

Here’s the weekly chart of the US Dollar.

Weekly Chart of US Dollar

Just like Oil, the US Dollar broke out above previous resistance in the 4th quarter of 2016. Specifically, this important piece of paper broke above $100 this past November. This level had sellers show up a few times in 2015. The ability of buyers to drive this major currency above $100 is significant. On the flip side, if the Dollar cannot hold $100, it could signal a false move. And from false moves, come fast moves in the opposite direction.

Here’s the daily chart of the Dollar.

Daily Chart of US Dollar

On the daily chart of the US Dollar, we’re testing that all-important $100 level. If price moves below this level, there is no reason to own this major. Above $100, own it. Below $100, don’t own it. It’s that simple. And if the Dollar moves down through this important level, we could have a false move on our hands, with selling pressure picking up and providing a major tailwind to the other important asset in this article, Oil.

We’ve covered a lot of ground and looked at some important charts. The thesis is simple. The next big move in Oil is likely to be dictated by the Dollar’s next move. If the Dollar breaks below $100, and Oil breaks upward out of consolidation, the thesis of Oil going to $75 becomes that much stronger. The opposite also applies. If the Dollar holds $100 and Oil drops back below $50, we want to own Dollars and have nothing to do with Oil.

As always, you can get free real-time updates and commentary about this opportunity and many more here: @360Research

AND, you’ve got FREE access to an investing tool we’ve created, The Ultimate ETF Cheat Sheet. It’s an easy-to-use resource guide.

Here’s to being on the right side of the trade.


Disclaimer: Nothing in this article should be construed as investment advice or a solicitation to buy or sell a security. You invest based on your own decisions.

Filed Under: Breakout, Commodity, Currency, Energy, False Move, Intermarket Analysis, Oil, Seasonality, Techniques & Tactics, U.S. Dollar Tagged With: $DBO, $USD, $USO, $UUP, $WTIC, Commodities, Correlation, Oil, US Dollar

March 22, 2015 | Posted by David Zarling, Head of Investment Research

Striking Oil

0
0
0
0
0
0
0
0
0
0
0
0
0
0
0
0
0
0
0
0
0
0
0
0

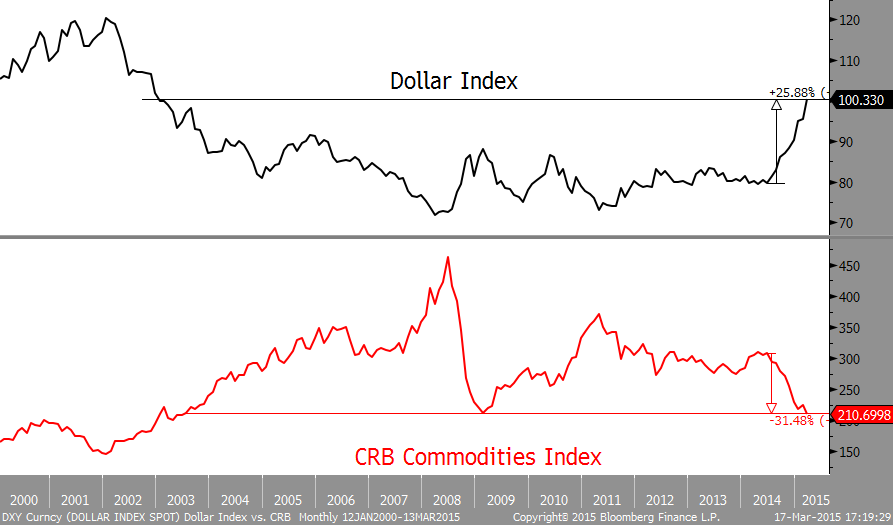
It’s hard to go a day without hearing or reading about the recent collapse in oil prices. And why wouldn’t we? The 60% drop in price over the past nine months is one of the greatest in history. In fact, the entire commodities complex has been hit hard during this time. But really, it should come as no surprise to investors that these price declines have taken place while the U.S. dollar has rapidly increased in value during this timeframe. Make sense, doesn’t it? Those items priced in U.S. dollars will decrease in price as the value of the U.S. dollar increases.

$USD and $CRB US Dollar and Commodities

(Source: charliebilello.tumblr.com)

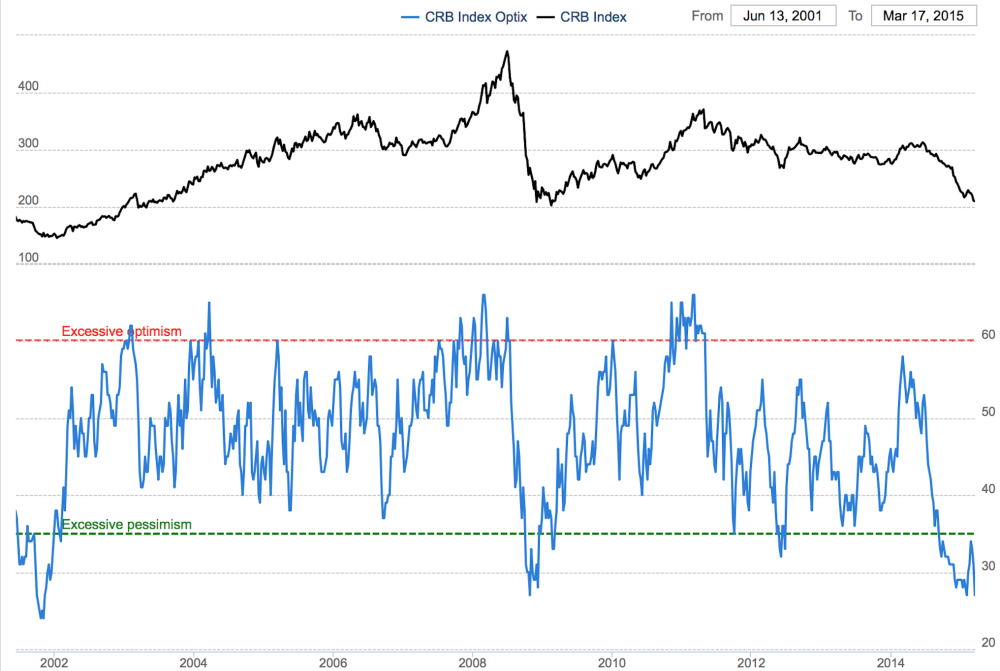
Everything from agricultural and soft commodities to industrial and precious metals have suffered significant price declines as the dollar has rocketed upward. Even though this price correction should not be a surprise, investors have become exceedingly pessimistic towards commodities. Such pessimism in the commodities space has not been this strong since the 2008-2009 financial collapse.

$CRB Sentiment

(Source: Shortsideoflong and SentimenTrader)

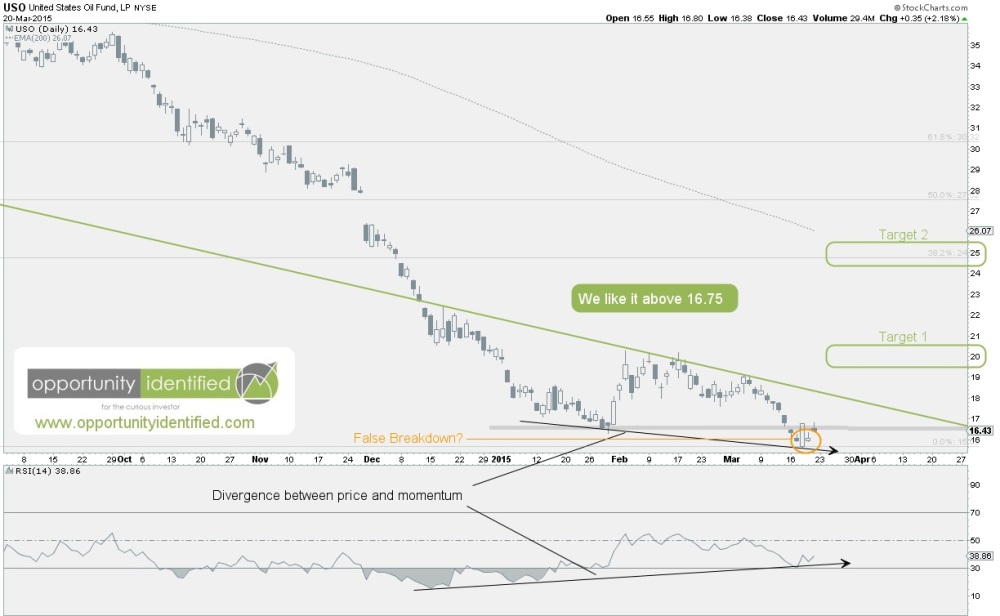
With such negativity prevalent in this space, we sit up, take notice, and look for opportunities. We think we’ve identified a well defined opportunity in oil, the focus of today’s article. Our oil investment tool of choice is USO, the United States Oil Fund – an ETF that tracks light, sweet crude oil. Looking at the two year chart of oil’s daily price below, we can see its impressive decline. And, we can see that it has developed a nice divergence between price and momentum (as measured by Wilder’s RSI).

$USO Daily Two Year

Zooming in, we can see the divergence up close and note the potential for a false breakdown if 16.75 is reclaimed. With the amount of investors shorting oil, the aforementioned set-up is ripe for a sharp reversal. If 16.75 can be reclaimed and the downward green trendline broken, price could move rapidly upward towards February’s highs (+19%) and even a 38.2% retracement of this epic collapse, which would be a 45% gain from these levels.

$USO Six Month

We like USO above 16.75. There is no reason to own it below that level, which lines up with the January lows. Our risk is defined. We don’t care if we own it above 16.75 and quickly turns back down and we get stopped out. Getting stopped out means we did something right – proper risk management. And if it doesn’t breakout above 16.75, no worries. We’ll wait some more. With this opportunity, our risk is well defined and the reward is heavily skewed in our favor. We’ll own it above 16.75. Below that, we’re not interested.


Disclosure: the author will consider a long position in USO based on the criteria provided in the article.

Disclaimer: nothing in this article should be construed as investment advice or a solicitation to buy or sell a security. Simply put, you are an adult. You invest based on your own decisions.

Filed Under: Commodity, Currency, Energy, ETF, Hard Commodity, Oil, U.S. Dollar Tagged With: $BRENT, $DBO, $UCO, $USD, $USO, $WTIC, Commodities, Oil, Pessimism, Sentiment, US Dollar

Find Out Our Top 10 Questions to Ask Your Financial Adivsor!

Subscribe to our mailing list today. No spam - we promise!

* indicates required
Tweets by @@360Research

Recent Posts

  • How To Get Involved In The Drug Trade (It’s Not What You Think!)
  • Invaluable Market Signal From The Value Line Geometric Index
  • This Is How To Navigate Amazon
  • Get Intel Inside Your Portfolio
  • Simple Market Secret: Just Look Left

Tags

$DBO $ES_F $INDU $SH $SPX $SPXA200 $SPY $TNX $USD $USO $UUP $VIX $WTIC $XLP $XLV Ascending Triangle Bonds Bottom breakout Confluence Consolidation Cycles demand descending triagle divergence Dow Jones Energy measured move Price Resistance risk/reward risk management RSX Russia RUT S&P 500 S&P500 SPY Supply TLT Trend Change trendline US Dollar Volatility weight of evidence

Copyright 360 Investment Research, LLC - All rights reserved © 2023