Opportunity Identified

for the curious investor

  • Home
  • About
    • Founder’s Story
    • This Blog
    • 360 Investment Research
    • The 360 Process
    • Client First Tax and Wealth Advisors
  • Insiders Only
  • Contact Us

May 1, 2017 | Posted by David Zarling, Head of Investment Research

One Important Divergence Bulls Need To See

0
0
0
0
0
0
0
0
0
0
0
0
0
0
0
0
0
0
0
0
0
0
0
0

Last time we checked, new all-time-highs are not a characteristic of bear markets. While all bear markets start from all-time-highs, not all-time-highs start a bear market. With many U.S. Indices recording new highs last week, we see uptrends still intact. And new all-time-highs have a tendency to make traders and investors nervous. In the end, we don’t need emotions involved in our investment decisions. We need to use hard data and the weight-of-evidence to guide us. And since we’re students of the markets and use intermarket relationships as part of our approach, we can look across sectors, industry groups, regions, and asset classes to get a top-down, big-picture view of market health. As part of that exercise, we want to see what areas are not making all-time-highs. Simply, as all-time-highs in U.S. markets are recorded, are there any important areas not currently joining the uptrend party? This is called divergence. Once such divergence market bulls need to keep an eye on is the Transportation sector. Take a look.

Weekly Chart of Transportation and S&p 500

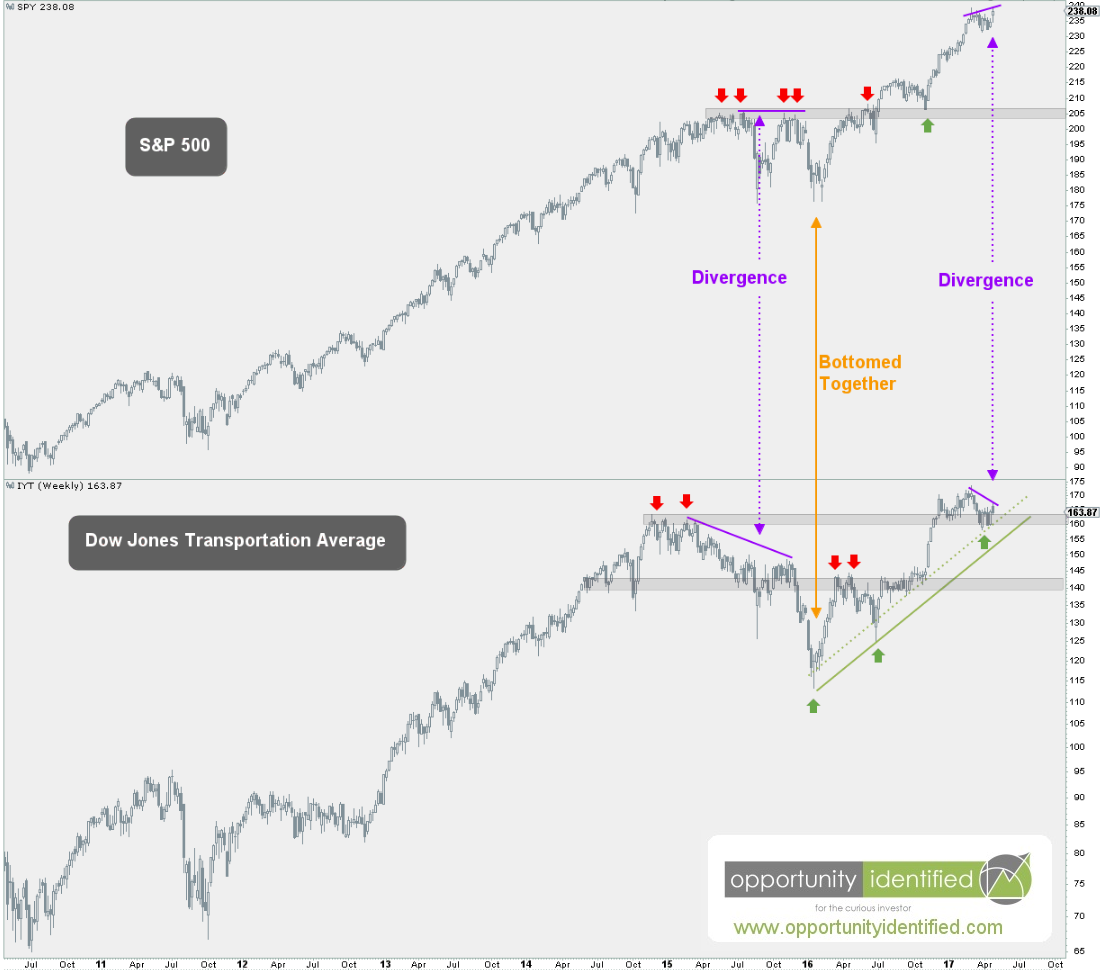
For many logical reasons, the Transportation sector is a bell-weather sector. This means it gives important clues about overall market health. This is due to its economic importance. If there is no demand to transport goods and commodities, it is logical that overall demand for those goods and commodities is to be desired. Many reading this will identify this relationship in regards to Dow Theory. For brevity’s sake, we’re not going to get into the nitty gritty of Dow Theory. We’ll save that for another post as it’s an important tenet of technical analysis. For now, we’ll observe the relationship in the chart above. Right away, we notice the Transportation industry giving important clues to market health in late 2014 through 2015. As U.S. markets were making new highs (using the S&P 500 as our proxy here), the Transportation sector was not. It was diverging. Making lower highs and lower lows. By very definition, this was not an uptrend. Rather, it was a downtrend. A downtrend that signaled caution for the overall market, which ended up selling off hard in July 2015. It came as no surprise when the S&P 500 bottomed exactly when Transports did the same. Together, they recorded higher highs and higher lows, the most significant new high coming in early November 2016. Since then, U.S. equities have been ripping. However, with last week’s new high across many U.S. indices, the Transportation sector recorded a divergence as it did not follow suit with new weekly highs. This is an important divergence bulls will want to see resolved to the upside. A breakdown here (below $160 using IYT, an ETF for the Dow Jones Transportation Average), would be problematic for broad market health. Conversely, if bulls are going to see this market continue to rip higher, we need the Transportation sector to participate. A new closing high above 170.74 would clear this divergence and indicate ongoing health for the overall market. Keep your eye on this one.

As always, you can get real-time updates and commentary about this development and many more opportunities here: @360Research

AND, you’ve got FREE access to an investing tool we’ve created, The Ultimate ETF Cheat Sheet. It’s an easy-to-use resource guide.


Disclaimer: Nothing in this article should be construed as investment advice or a solicitation to buy or sell a security. You invest based on your own decisions. Everything in this post is meant for educational and entertainment purposes only. I or my affiliates may hold positions in securities mentioned in this blog. Please see our Disclosure page for full disclaimer.

Filed Under: Breakout, Dow Jones Industrials, Dow Transports, Equity, Market Environment & Structure, Market Outlook, S&P 500, Trend Analysis Tagged With: $IYT, $IYY, $SPY, divergence, Dow Jones Transportation Average, Dow Theory, S&P 500, Transports

October 15, 2015 | Posted by David Zarling, Head of Investment Research

Mega Pattern On The Dow

0
0
0
0
0
0
0
0
0
0
0
0
0
0
0
0
0
0
0
0
0
0
0
0

A unique pattern on the Dow Jones Industrials Average has been in the works for almost two decades. Developing since the late 90’s, this broadening formation of price is called a megaphone pattern. Just as the pattern suggests, price forms boundaries, that when connected with trend lines, form the shape of a megaphone. We can take a look at this formation in the chart below.

DOW MEGAPHONE

(click to enlarge)

As you can see, these trendlines identify important price levels on the Dow, a major U.S. largecap index worth paying attention to. When we connect the lows from the late 90’s, 2002, and 2009 we get a downward sloping trend line. When we connect the highs from 1999 and 2007, we get an upward sloping trendline. What makes this pattern significant is that price is reacting strongly to this level. In fact, just recently, price rapidly fell through it and now this 15 year old upper trendline is providing stiff resistance. Let’s take a closer look.

DOW MEGAPHONE Close-up

(click to enlarge)

As you can see, this trendline has significance. We are not interested in U.S. largecaps until this trendline is recaptured. That could happen today. It could happen tomorrow. No one knows. If anyone tells you they know where price is headed, they are fooling you. As for us, we’ll continue to let price guide us. And right now, this development carries significant risk.

As always, trade safe. We’ll keep you updated on price.


Disclaimer: Nothing in this article should be construed as investment advice or a solicitation to buy or sell a security. You invest based on your own decisions.

Filed Under: Dow Jones Industrials, Equity, Market Outlook, Pattern Recognition Tagged With: $DDM, $DJIA, $DOG, $DXD, $INDU, $SDOW, $UDOW, DIA, Dow Jones, Dow Jones Industrial Average, Largecaps, megaphone, pattern recognition, Trend Change, trendline

October 19, 2014 | Posted by David Zarling, Head of Investment Research

Attention Slow Money (IRAs / 401ks) – Risk Ahead!

0
0
0
0
0
0
0
0
0
0
0
0
0
0
0
0
0
0
0
0
0
0
0
0

Investing is all about risk management. Preventing loss is just as important as realizing gain. There are periods in the market where Return of Capital is the more appropriate approach than Return on Capital. Now is one of those times. Those retirement vehicles (401ks, IRAs, etc.) that have exposure to the US equity markets would be prudent to reduce that exposure at this time. You are an adult. You make your own decisions. You do not make investment decisions based on what you read here. You know the drill.

The last couple weeks have done some structural damage to the market. We identified the need to watch the S&P 500 closely back on October 8th. Those levels broke down and were a sign to look for lower prices. We got lower prices and even broke significant support at 1900 on the S&P (by the way, breaking significant support levels are a hallmark of a directionally shifting market – in this instance, from an up trending market to a down trending market). What did this breakdown mean? Something has changed. Specifically, the likelihood of lower prices ahead has increased. That means risk has increased. We don’t like to lose money if we don’t have to… So when the market tells us something has changed, we listen. You should too.

After a good deal of studying many markets and charts, I’ve identified some levels on three US major markets (Dow, S&P 500, and Russell 2000) that would need to be recaptured in order for any equity exposure to be increased or reestablished. Right now, the risk of loss is too high to consider hanging around to see what happens. If these levels are not recaptured soon, then lower prices are likely. If these levels are not recaptured, the best case scenario is sideways price action for a few weeks. One thing is for sure, the next few weeks have a high likelihood of volatility (large price swings), which is also a hallmark of trend change.

In summary, the current potential for reward it too low compared to the current exposure to downside risk. The body of evidence (including Intermarket behavior, cycles, internal breadth, seasonality) point to a dangerous week ahead. We even noticed that today marks the 27th anniversary of the 1987 stock market crash. Does that mean it will again this week? Absolutely not. But volatility and risk are upon us. Buyers beware. Risk ahead!

Here are our levels as annotated on the charts. Hopefully, we can recapture these levels and evaluate the next move. Be careful, curious investor.

10-19-2014 Important level on SPX
Need to recapture 1905
Need to recapture 16600
Need to recapture 1100

Filed Under: Dow Jones Industrials, Equity, Market Outlook, Risk Management, S&P 500, Supply and Demand, Techniques & Tactics, Trend Analysis Tagged With: $INDU, $SPX, Dow, Dow Jones, Market Shift, Return of Capital, Return on Capital, risk, risk management, Russell 2000, RUT, S&P 500, slow money, Trend Change

October 17, 2014 | Posted by David Zarling, Head of Investment Research

Next Week is a Big Week for the Market

0
0
0
0
0
0
0
0
0
0
0
0
0
0
0
0
0
0
0
0
0
0
0
0

The major US markets have been structurally damaged, increasing the likelihood of a large correction beyond what we’ve already seen. That being said, we are keeping an open mind and searching for evidence that we could see a short term bounce in the US market (S&P 500, Dow, Russell 2K). Here are some signs that we’re getting ready for a relief rally:

  • Russell 2K (See chart below) | Positve candle formation and a daily close above previously broken support (1082). The Russell 2K tends to give early signs compared to the rest of the majors. The basing by this small cap index is a positive development. It is very close to reaching 1100 and closing our Russell 2K short trade. *NOTE: at publication time (close of trading, Friday), the positive candle development turned neutral if not bearish.
  • 50 day Rate of Change (ROC) on the McClellen Summation Index (not shown) | This indicator looks at the 50-day rate of change (ROC) in the Summation Index. It simply compares today’s value to that of 50 trading days ago.  Mathematically, it is another way of quantifying the total of the last 50 trading days’ McClellan Oscillator values. When it gets to a deeply negative value, it indicates a longer term oversold condition for the market, one which is difficult to sustain past a certain point. When this indicator turns back up again, the message is that the big oversold condition is waning, and a rebound period is getting started. That is the condition in which we find ourselves now.
  • The CBOE VIX Index (See chart below) needs a breather | The VIX gets its share of criticism, but in rapidly moving markets it has its place in the toolbox. Research by Nick Colas of Convergex shows that the long term VIX average – back to 1990 – is 20 and the standard deviation around that mean is 6. That means at 26 and 32 you have 2 reasonable levels where the VIX should top out. Now, if you think we are entering a period of real crisis, the numbers shift higher. Typically the VIX averages 28 when things are really bad (think back to the Financial Crisis) and the standard deviation rises to 8. That puts the target at 36 and 44. Bottom line: don’t try to pick a bottom until the VIX gets to at least 26. We reached 26.00 yesterday. *NOTE: at publication time (close of trading, Friday), the VIX closed at 21.99.

The evidence above points to a short term bounce. But as of this writing (close of trading), it appears the bounce may have already taken place intra-day on Friday. To say the least, the market is at a major inflection point. We’ll provide more research, analysis, and if/then game-planning over the weekend. Next week is a big week for the market. Time to do some homework…

RUT trying to recapture previous support now turned into resistance
VIX closes at 26 (a little above it)

Filed Under: Candle Sticks, Dow Jones Industrials, Education, Equity, ETF, Market Environment & Structure, Market Outlook, S&P 500 Tagged With: $SPX, $VIX, Bottom, Bounce, Candle formation, Candlestick, Convergex, Inflection Point, McClellen Oscillator, McClellen Summation Index, Nick Colas, Resistance, ROC, RUT, SPY, Support

Find Out Our Top 10 Questions to Ask Your Financial Adivsor!

Subscribe to our mailing list today. No spam - we promise!

* indicates required
Tweets by @@360Research

Recent Posts

  • How To Get Involved In The Drug Trade (It’s Not What You Think!)
  • Invaluable Market Signal From The Value Line Geometric Index
  • This Is How To Navigate Amazon
  • Get Intel Inside Your Portfolio
  • Simple Market Secret: Just Look Left

Tags

$DBO $ES_F $INDU $SH $SPX $SPXA200 $SPY $TNX $USD $USO $UUP $VIX $WTIC $XLP $XLV Ascending Triangle Bonds Bottom breakout Confluence Consolidation Cycles demand descending triagle divergence Dow Jones Energy measured move Price Resistance risk/reward risk management RSX Russia RUT S&P 500 S&P500 SPY Supply TLT Trend Change trendline US Dollar Volatility weight of evidence

Copyright 360 Investment Research, LLC - All rights reserved © 2023