If you follow us on Twitter (@360Research), it’s not a secret that we’ve been talking about emerging markets and other international indexes outperforming US stocks. One such market is in Singapore. After seeing the Straits Times index decline 30% over the last year, we’re now seeing new demand enter Singaporean stocks. The Straits Times Index is a capitalization-weighted stock market index that is a benchmark for the Singapore stock market. It tracks the performance of the top 30 companies listed on the Singapore exchange. And it’s a great barometer for us to look at when trying to identify our next opportunity in Singapore.
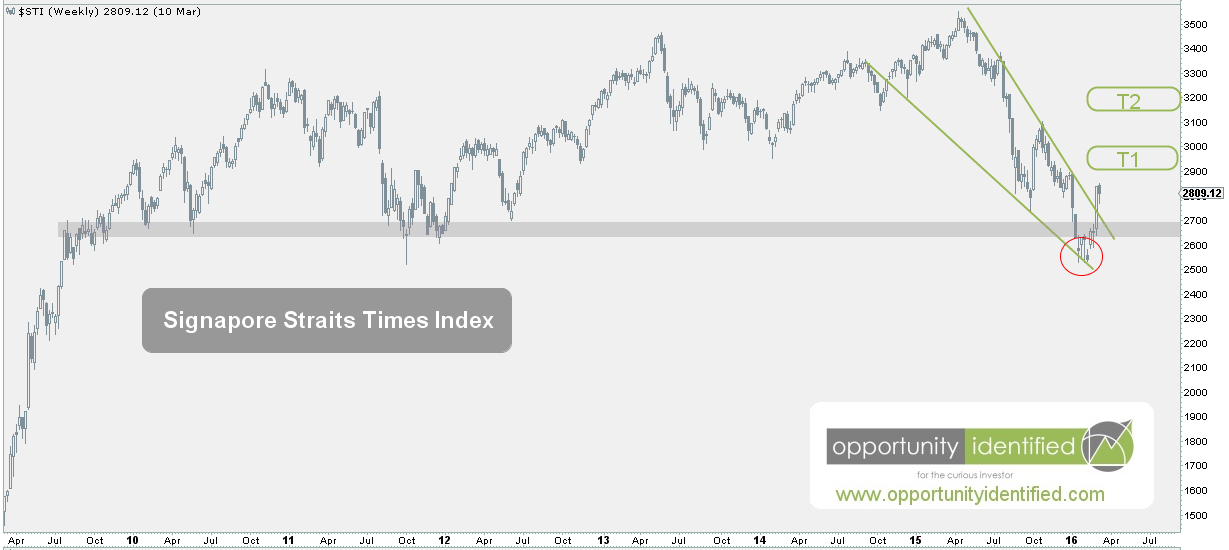
Using the weekly chart below, we can see the downtrend in prices that began in early 2015. We can also see that in early 2016, prices dropped below the late 2011 low, only to sharply reverse and break out from the downtrend (upper green trend line).
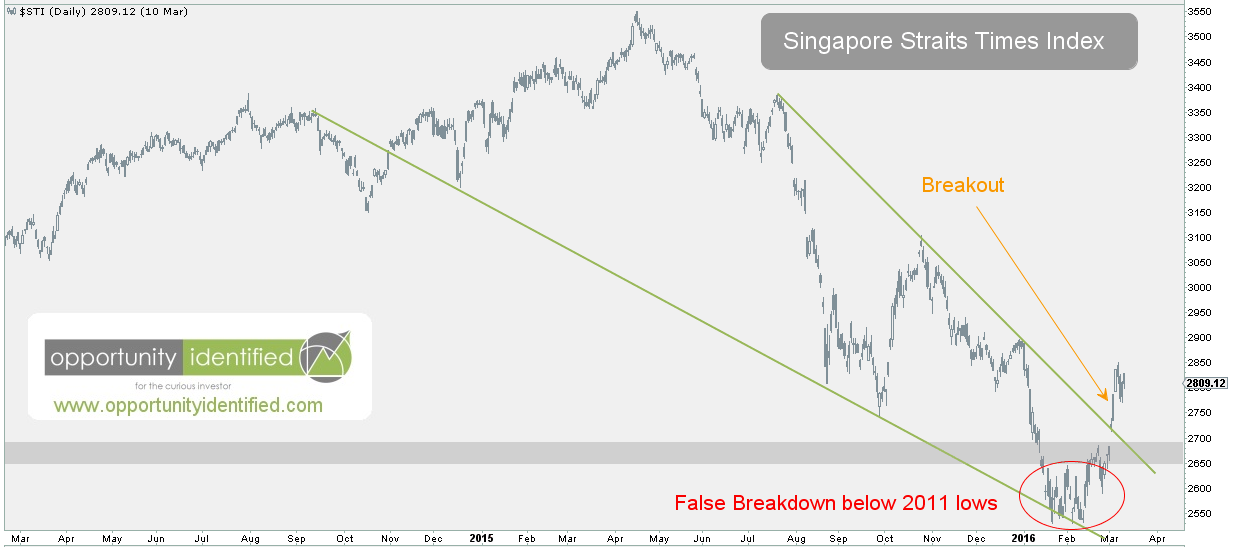
Looking closer at The Straits times using a two-year daily chart, we can see the false breakdown and subsequent clean breakout of this important index.
We don’t have the ability to trade the Straits Times Index directly. But in today’s world, we have access to all sorts of investment vehicles that grant us entrance into many hard-to-reach markets. For us, and this article, the ETF: EWS is our vehicle of choice. It mirrors the Straits Times Index, allowing us to appropriately manage our trade and help us identify risk and reward. We should never enter a trade without knowing when we’re wrong. Remember, the markets don’t care what we think. And we don’t care about being right. We care about being on the right side of the trade.
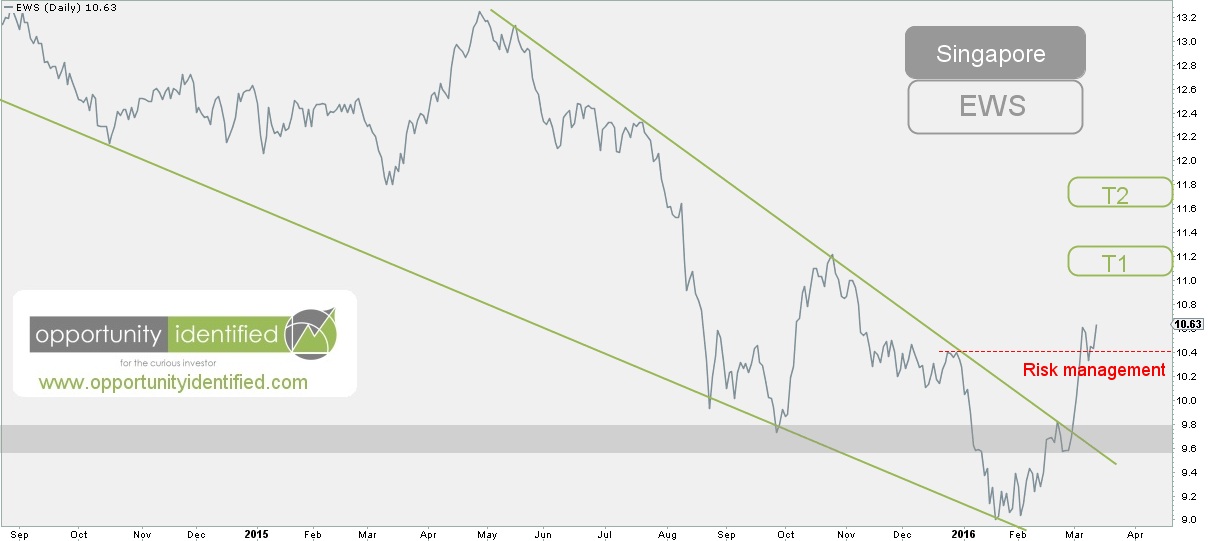
When looking at the daily chart of EWS, we notice that 10.40 is a logical area of previous supply that has now become an area where demand should step in. If price drops below that level, we’re no longer interested in this trade. It’s simple, we’re long above 10.40, and out below it. Our upside reward is between 5 and 15%. We like a lot of what we’re seeing from Singapore, the Merlion and even the Durian.
Disclaimer: Nothing in this article should be construed as investment advice or a solicitation to buy or sell a security. You invest based on your own decisions.